ULTRA-PRECISION LINEAR MOTION METROLOGY
Ronnie R. Fesperman, M. Alkan Donmez, and Shawn P. Moylan
ABSTRACT
Many new emerging applications of nanotechnologies require the use of compact precision linear translation stages that have positioning resolution on the order of a nanometer and an exceptionally long range of motion on the order of tens of millimeters. Such devices are expected to perform with sub-micrometer positioning accuracy and repeatability. Manufacturers and consumers of such systems have begun to recognize the difficulties in certifying the performance of these systems with appropriate levels of measurement uncertainty. Sources of measurement uncertainty that were once considered insignificant when measuring in the micrometer regime are now very significant when measuring in the nanometer regime. This paper describes the work being performed to investigate and evaluate the use of interferometry for measuring and determining the accuracy and repeatability of positioning numerically-controlled axes with levels of uncertainty of a few nanometers or better.
INTRODUCTION
For many years, the geometric accuracy and repeatability of positioning numerically-controlled machine axes have been characterized using the measurement guidelines and analyses outlined by national and international standards [1,2]. The most popular instrument for performing these measurements has been the displacement measuring interferometer (DMI), consisting of a stabilized laser source with a nominal wavelength of 633 nm, interferometer optics, retroreflector, and a weather station used for correcting the laser wavelength for changes in the refractive index of air and for correcting displacement errors caused by thermal expansion of the linear axis. Measurements of traditional machine tool axes with specified positioning accuracies and repeatabilities on the order of tens of micrometers have been made using DMI systems because uncertainty in DMI measurements have been at best an order of magnitude better than the reported specifications. However, many new ultra-precision machine tools and instruments use ultra-precision linear positioning systems with resolutions on the order of a nanometer coupled with exceptionally long ranges of motion (tens of millimeters) requiring sub-micrometer positioning accuracy and repeatability. A few applications include, semiconductor wafer inspection, micro/meso-machining, and photonic alignment, to name a few.
Such systems, mostly made of aluminum structures, are compact with heights ranging from 20 mm to 72 mm and widths ranging from 90 mm to 230 mm, and offer linear travels ranging from 20 mm to 160 mm with resolutions from 1 nm to 5 nm. In general, positioning is achieved with direct-drive, non-contact linear motors, high resolution linear encoders, and precision control. Performance specifications provided for these systems vary with accuracies ranging from 250 nm to 5 μm, bidirectional repeatabilities ranging from 50 nm to 200 nm, unidirectional repeatabilities ranging from 25 nm to 100 nm, and angular errors (pitch & yaw) ranging from 5 arc seconds to 20 arc seconds.
Measuring and certifying the linear positioning performance of this class of linear positioning system with DMI will be very challenging if the test uncertainty ratio (TUR) is to be greater or equal to 4:1 as indicated in [3]. For example, a measurement of the unidirectional repeatability with a specification of ± 25 nm will require an expanded measurement uncertainty, \(U\), of approximately 6 nm or less. Assuming a 95 % level of confidence in the measurement, where \(U = 2u_c\) (i.e., the coverage factor, \(k\), equals 2), will require a combined standard uncertainty, \(u_c\), of approximately 3 nm or less.
To address the challenges for characterizing such systems with appropriate measurement uncertainties, we started an effort to extend our linear displacement measurement capabilities for this operational regime. A preliminary uncertainty analysis was performed to estimate the measurement uncertainty in characterizing a typical ultra-precision translation stage with our planned measurement system. The positioning system performance specifications used for this analysis are given in Table 1. Existing international standards [2,4] and the Guide to the Expression of Uncertainty in Measurement (GUM) [5] were used as guidelines for this uncertainty analysis.
| Specification | Value | Unit |
|---|---|---|
| Travel | 50 | mm |
| Accuracy | ±250 | nm |
| Resolution | 1 | nm |
| Bi-direct Repeat | ±50 | nm |
| Uni-direct Repeat | ±25 | nm |
| Pitch/Yaw | ±10 | arc sec |
| Material | Al | --------- |
MEASUREMENT SETUP
Linear positioning measurements will take place on top of a passive vibration isolation table located in an environmentally controlled laboratory where the temperature is controlled to 20 °C ± 0.1 °C. The measurement system currently being assembled is a single-pass heterodyne DMI consisting of a laser source, beam splitter, and retroreflector. A commercially available Helium-Neon dual frequency 20 MHz laser with a nominal laser wavelength of 633 nm and wavelength accuracy of 0.1 parts per million (ppm) is used as the laser source. Reference and measurement signals from the interferometer will be captured by fiber optic couplings and transmitted via fiber optic cables to a measurement board where displacement will be determined with a resolution of 0.62 nm.
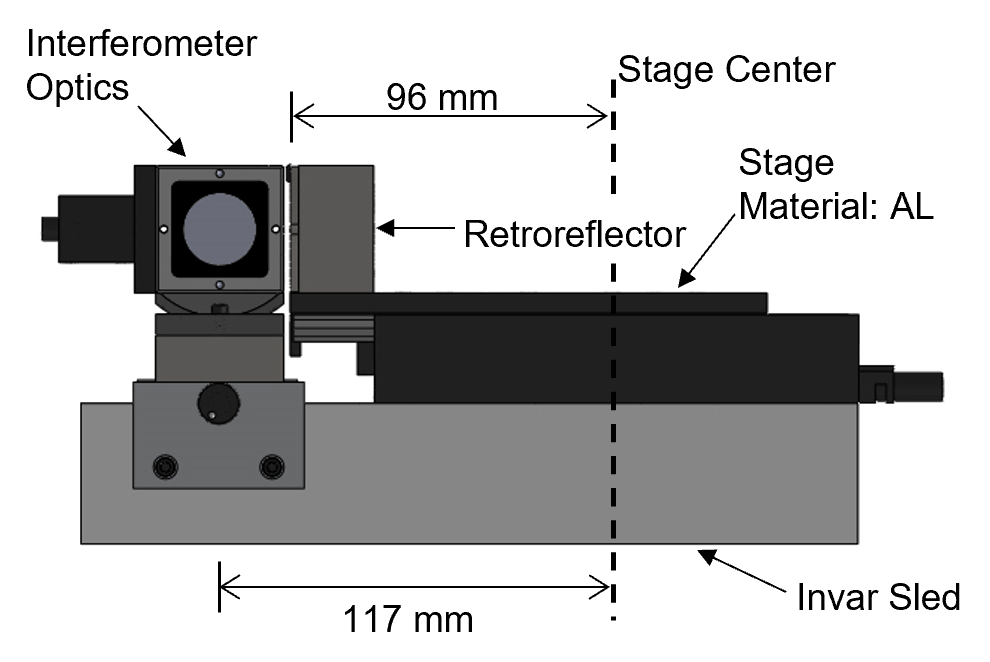
The linear positioning stage and the interferometer optics will be connected through an alignment sled manufactured from Invar, shown in Fig. 1. The sled, positioned against a guide rail, will be used for speeding up the coarse alignment of the laser beam and stage by allowing the operator to slide the sled the entire length of the rail while adjusting the laser. The sled will also be used to reduce both the thermal and measurement loops. Precision alignment of the laser beam and stage travel will be achieved using a combination of precision adjusters mounted to the laser and a beam position sensing detector (PSD) with an accuracy of approximately ± 0.03 mm.
Changes in the laser wavelength due to changes of the refractive index of the surrounding air will be automatically compensated during the measurement process. At startup, the refractive index of air will be determined using Edlen's equation [6,7] and by measuring temperature, barometric pressure, and relative humidity with a thermistor, pressure transducer, and humidity sensor with accuracies of ± 0.005 °C, ± 16 Pa, and ± 2 %, respectively. Changes in the refractive index of air will then be tracked using a commercially available wavelength compensator (refractometer) that can detect a 1.1×10⁻⁹ change in refractive index. Material temperature changes in the sled and stage will be monitored using surface mount thermistors, each having a measurement accuracy of ± 0.1 °C. Each environmental sensor will be positioned as close to the measurement path as possible to most accurately measure environmental changes occurring within the measurement loop. The operator will monitor and control the measurement process through a graphical user interface and personal computer.
UNCERTAINTY ANALYSIS
Multiple sources of error contribute to the uncertainty in measurement when measuring the performance of an ultra-precision axis. In this analysis, each error source is assumed to be uncorrelated and to have a rectangular probability distribution. Each one is estimated assuming that its respective error value lies within a possible range of \( \pm a \) or \( \left(a^+ - a^- \right) \). The standard uncertainty, \(u_i\), associated with each error source is described by Eq. 1.
$$u_i = \frac{a^+ - a^-}{2\sqrt{3}}$$
(1)
The uncertainties due to the individual error sources are combined according to Eq. 2.
$$u_c = \sqrt{\sum_{i} u_i^2}$$
(2)
Unidirectional repeatability, \(R_i \uparrow\), for positioning an axis at a position, \(x_i\), is described by Eq. 3.
$$R_i\uparrow = 4\cdot s_i \uparrow$$
(3)
where \(s_i\) is the standard deviation of the measurement values, \(x_{ij}\), recorded at position \(x_i\) by a series of N unidirectional approaches (N = 5) and 4 represents the range of the data for a coverage factor of 2, i.e. ± 2\(s_i\). As described by Eq. 4, the unidirectional repeatability for an entire axis is the maximum repeatability value of all positions.
$$R\uparrow = max \left(R_i \uparrow\right)$$
(4)
The uncertainty for the unidirectional repeatability is four times the uncertainty of the standard deviation, \(u\left(s\right)\) in positioning and is described by Eq. 5.
$$u\left(R\uparrow\right) = 4\cdot u\left(s\uparrow\right)=4\cdot u_x\sqrt{\frac{1}{N-1}}=4\cdot \sqrt{\frac{1}{N-1}}\cdot u_{EVE}$$
(5)
where \(u_x\) is the uncertainty in positioning with the only contributor being the uncertainty due to the environmental variation error, \(u_{EVE}\). Bidirectional repeatability, \(R\), for an axis is the maximum of the bidirectional repeatability values, \(R_i\), described by Eq. 6.
$$R_i = max\left[2s_i\uparrow +2s_i\downarrow +|B_i|;\: R_i \uparrow;\: R_i\downarrow \right]$$
(6)
where \(B_i\) is the reversal value at a position. The uncertainty for bidirectional repeatability is described by Eq. 7.
$$u\left(R\right) = \sqrt{u\left(B\right)^2+u\left(R\uparrow,R\downarrow\right)^2}$$
(7)
where \(u\left(B\right)\)is the uncertainty in the reversal value described by Eq. 8.
$$u\left(B\right) = 2\cdot\sqrt{\frac{u^2_{EVE}}{N}+u^2_{SETUP}}$$
(8)
where \(u_{SETUP}\) is the uncertainty due to the repeatability of the measurement setup. The accuracy, \(A\), for a bidirectional measurement of positioning an axis is determined by Eq. 9 and the uncertainty for the accuracy measurement is determined by Eq. 10.
$$A = max\left[\bar{x}_i\uparrow+2s_i\uparrow; \bar{x}_i\downarrow+2s_i\downarrow\right]-min\left[\bar{x}_i\uparrow-2s_i\uparrow; \bar{x}_i\downarrow-2s_i\downarrow\right]$$
(9)
$$u\left(A\right) = \sqrt{u\left(E\right)^2+u\left(R\uparrow,R\downarrow\right)^2}$$
(10)
where \(\bar{x}_i\) is the arithmetic mean of the positional deviations and \(u\left(E\right)\) is the uncertainty due to the bidirectional systematic positional deviation described by Eq. 11
$$u\left(E\right) = \sqrt{u^2_{DEVICE}+u^2_{MISALIGNMENT}+u^2_{SETUP}+\frac{u^2_{EVE}}{n}}$$
(11)
where \(u_{DEVICE}\) is the uncertainty due to the measuring device, and \(u_{MISALIGNMENT}\) is the uncertainty due to misalignment of the measuring device and the axis of travel.
Measurement Device Uncertainty
Uncertainty due to the measuring device is described by Eq. 12.
$$u_{DEVICE} = \sqrt{u^2_{\lambda}+u^2_{M,n}+u^2_{DP}+u^2_{DR}}$$
(12)
where \(u_{\lambda}\) is the uncertainty due to laser wavelength accuracy, \(u_{M,n}\) is the uncertainty in correcting for changes in laser wavelength due to changes in the refractive index of air, \(u_{DP}\) is the uncertainty due to the dead-path error, and \(u_{DR}\) is the uncertainty due to the device resolution. For this application the dead-path distance is assumed to be negligible and \(u_{DP}\) is set to zero. The laser head used has a specified lifetime wavelength accuracy, \(\lambda_A\), equal to ± 0.1 ppm and the resolution, \(r\), provided by the measurement board is 0.62 nm. Uncertainty due to laser wavelength accuracy is described by Eq. 13.
$$u_{\lambda} = \frac{L \cdot \left(\lambda _A - ^-\lambda _A\right)}{2 \sqrt{3} } = 2.9 \: nm $$
(13)
where \(L\) is the measurement length and is set to the maximum travel of the stage, i.e. \(L\) = 50 mm. Device resolution uncertainty is determined by Eq. 14.
$$u_{DR} = \frac{r}{2 \sqrt{3}} = 0.2 \: nm$$
(14)
The uncertainty in correcting for changes in the refractive index of air is described by Eq. 15.
$$u_{M,n} = u_n \cdot L $$
(15)
where \(u_n\) is the uncertainty in determining the refractive index of air. The refractive index of air, \(n\), as described by Edlen's equation [6], is a function of the ambient air temperature, barometric pressure, and relative humidity and the uncertainty in determining the refractive index of air can be described by Eq. 16.
$$u_n = \sqrt{\left(\frac{\partial n}{\partial T}\right)^2 u^2_{TD}+\left(\frac{\partial n}{\partial P}\right)^2 u^2_{PT}+\left(\frac{\partial n}{\partial H}\right)^2 u^2_{RHS}}$$
(16)
where \(u_{TD}\), \(u_{PT}\) and \(u_{RHS}\) are the uncertainties in measuring air temperature, barometric pressure, and relative humidity and are equal to 0.003 °C, 9.3 Pa, and 1.2 %, respectively. For this application, the uncertainty of the refractive index is estimated to be 0.027×10⁻⁶ resulting in a measurement correction uncertainty at maximum travel of 1.4 nm. The resulting combined uncertainty for the measuring device, \(u_{DEVICE}\), is estimated to be 3.2 nm.
Alignment Uncertainty
Misalignment between the laser beam and the direction of travel of the stage axis (out of parallelism) can cause an error in the displacement measurement. The standard uncertainty due to misalignment is estimated by Eq. 17.
$$u_{MISALIGNMENT} = \frac{L \cdot \left(1 - \cos \gamma \right)}{2 \sqrt{3}}$$
(17)
where \(\gamma\) is the angle of misalignment determined by Eq. 18.
$$\gamma = \sin ^{-1} \frac{\Delta h}{L}$$
(18)
where \(\Delta h\) is the maximum beam deviation at full travel equal to ± 0.03 mm. The resulting alignment angle is approximately 124 arc seconds resulting in a maximum standard uncertainty due to misalignment of 2.6 nm.
Measurement Setup Uncertainty
Positioning accuracy and repeatability will vary between different lines of measurement if the axis being measured possesses pitch and/or yaw characteristics. If the measurement data is used for calculating the volumetric accuracy, for compensation purposes, or if the measurement is repeated for verification of performance certification, then the setup error influences the measurement length. To minimize this effect, sound precision engineering practices employing minimum constraint design and precision mechanical alignment techniques will be used to appropriately assemble each measurement setup and ensure a low variability in lines of measurement. The standard uncertainty associated with the measurement setup, \(u_{SETUP}\), is described by Eq. 19.
$$u_{SETUP} = \frac{\sqrt{2} \cdot O_{ABBE} \cdot D_{ANGLE}}{1000 \cdot 2 \sqrt{3}}$$
(19)
where \(O_{ABBE}\) is the estimated maximum change in Abbe offset between two possible lines of measurement in millimeters and \(D_{ANGLE}\) is the maximum angular error of the axis being measured in micrometers per meter. The maximum angular deviation of the stage is obtained from Table 1 as 10 arc seconds (48.5 μm/m) and it is assumed that the maximum change in Abbe offset will be no more than 0.1 mm. The standard uncertainty resulting from the measurement setup and the angular characteristics of the stage is estimated to be 2.0 nm.
Environmental Variation Error Uncertainty
During the time it takes to perform the measurement, the measurement setup and/or environment may drift causing a measurement error known as environmental variation error \(\left(E_{VE}\right)\). \(E_{VE}\) is taken as the range of the data recorded while performing a drift test with the stage carriage held at the maximum travel position. Presently, the complete experimental setup exists only in a virtual (design) state making it impossible to perform a drift test. For this reason, the environmental variation error is estimated by estimating the effects caused by thermal expansion of the experimental setup. The linear positioning measurement process will be relatively slow with the stage coming to rest at each measurement position. It is assumed that the temperature of the experimental setup will not vary more than the temperature swing of the lab and any changes in position measurement during the drift test will be due to the temperature swing of the lab. In this analysis, it is assumed that the stage and the interferometer optics are attached to the Invar sled at their respective centers, see Fig. 1, and are allowed to thermally expand from center. The retroreflector is attached to the end of the carriage. It is also assumed that the stage zero position or the placement of the encoder read head is located at the center of the stage base. \(E_{VE}\) is estimated as the difference in the change in position of the interferometer optics and retroreflector after a maximum temperature swing, \(\Delta T\), of 0.1 °C and is described by Eq. 20.
$$E_{VE} = \left( \alpha _{AL} \cdot d_1 - \alpha _{INVAR} \cdot d_2 \right) \cdot \Delta T = 211 \: nm$$
(20)
where \(d_1\) and \(d_2\) are the distances from stage center to the optical components and \(\alpha _{AL}\) and \(\alpha _{INVAR}\) are the coefficients of thermal expansion of the stage and sled material, i.e., \(\alpha _{AL}\) = 23.6 μm/m∙°C and \(\alpha _{INVAR}\) = 1.3 μm/m∙°C. Thermal growth of the optical components is ignored in this estimate. The standard uncertainty due to \(E_{VE}\) is described by Eq. 21.
$$u_{EVE} = \frac{E_{VE}}{2 \sqrt{3}} = 122 \: nm$$
(21)
Because the uncertainty due to \(E_{VE}\) is relatively large when compared to the desired uncertainty for unidirectional repeatability, the measurement data will be automatically compensated for changes in thermal growth of the setup. Therefore, the standard uncertainties of the material temperature measurements, \(u_{TM,i}\), and the thermal expansion coefficients, \(u_{EM,i}\), must be considered. The uncertainty due to the temperature measurement of the material (in this estimate the ambient air) is given by Eq. 22.
$$u_{TM,i} = \alpha _i \cdot d_i \cdot u\left(\Theta\right)$$
(22)
where \(u\left(\Theta\right)\)is the standard uncertainty due to the temperature measuring device and is equal to 0.003 °C. The resulting uncertainties due to temperature measurements of the sled, \(u_{TM,INVAR}\), and carriage, \(u_{TM,AL}\), are 0.5 nm and 6.8 nm, respectively. The standard uncertainty due to the material coefficient of thermal expansion is described by Eq. 23.
$$u_{EM,i} = \Delta T \cdot d_i \cdot u\left(\alpha _i \right)$$
(23)
where \(u\left(\alpha _i\right)\)is the uncertainty of the material expansion coefficient and is estimated by assuming a minimum range of 10% of the nominal value and is transferred to a standard deviation according to E q. 24.
$$u_{\left(\alpha _i \right)} = \frac{0.1 \cdot \alpha _i}{2 \sqrt{3}}$$
(24)
\(u\left(\alpha _{INVAR}\right)\) and \(u\left(\alpha _{AL}\right)\) are 0.04 μm/m∙°C and 0.68 μm/m∙°C, respectively, resulting in standard uncertainties due to the material expansion coefficients \(u_{EM,INVAR}\) and \(u_{EM,AL}\) of 0.4 nm and 6.5 nm, respectively. The standard uncertainty due to \(E_{VE}\) is now equal to the standard uncertainty due to the compensation of the material temperatures and is described by Eq. 25.
$$u_{EVE} = \sqrt{u^2_{TM,INVAR} + u^2_{EM,INVAR} + u^2_{TM,AL} + u^2_{EM,AL}} = 9.3 \: nm$$
(25)
UNCERTAINTY RESULTS
The resulting combined standard and expanded uncertainties for the performance parameters are listed in Table 2 and the uncertainty estimates for each contributor are listed in Table 3.
| Parameter | u(i) | U(i) (k=2) | Unit |
|---|---|---|---|
| R↑ | 18.5 | 37 | nm |
| B | 9.2 | 18.3 | nm |
| R | 20.6 | 41 | nm |
| E | 6 | 12 | nm |
| A | 19.5 | 39 | nm |
| Contributor | Value | Unit |
|---|---|---|
| uλ | 2.9 | nm |
| uTD | 0.005 | °C |
| uPT | 16 | Pa |
| uRHS | 2 | % |
| un | 0.027 | ppm |
| uM,n | 1.4 | nm |
| uDP | 0 | nm |
| uDR | 0.1 | nm |
| uDEVICE | 3.2 | nm |
| uMISALIGNMENT | 2.6 | nm |
| uSETUP | 2.0 | nm |
| u(Θ) | 0.003 | °C |
| uTM,INVAR | 0.5 | nm |
| uTM,AL | 6.8 | nm |
| uαINVAR | 0.04 | μm/m-°C |
| uαAL | 0.68 | μm/m-°C |
| uEM,INVAR | 0.4 | nm |
| uEM,AL | 6.5 | nm |
| uEVE | 9.3 | nm |
DISCUSSION OF RESULTS
The results from this analysis clearly highlight the challenges in measuring the performance of this class of linear positioning system with a TUR of 4:1 using our current measurement system. The expanded uncertainty in measuring the unidirectional repeatability exceeds the performance specification of 25 nm by a factor of 1.5 and the expanded uncertainty in bidirectional repeatability is approximately equal to the specified performance of 50 nm producing a TUR of 1:1. The largest contributor to the measurement uncertainty in this analysis is the uncertainty in compensating for the environmental variation error (\(u_{EVE}\) = 9.3 nm). However, this analysis is based on the assumption that the temperature of the experimental setup will only change with room temperature. If heat, caused by bearing friction, the motor, or other sources, is added to the stage causing the stage temperature to vary more than the temperature of the lab then the previous assumption will be false. In this case, the analysis for the uncertainty due to the bidirectional systematic positional deviation, \(u\left(E\right)\), will need to also include the uncertainty due to machine temperature compensation, \(u_T\) , and the uncertainty of the surface mount thermistors. To provide an example of the significance of \(u_T\) as a contributor to the measurement uncertainty, we will assume the stage temperature varies by at least 1 °C from 20 °C. In this case, the contribution to the standard measurement uncertainty will be approximately 150 nm.
One method for reducing the measurement uncertainty may include replacing the existing laser source and environmental sensors with products that have better specified accuracies and/or uncertainties. For example, this may include replacing the existing laser with an iodine stabilized laser source that has a wavelength accuracy better than 1 part in 1010. Doing so would further reduce the uncertainty due to wavelength accuracy to a level well below a nanometer which would, in-turn, reduce the device uncertainty to 1.4 nm or better.
Another method for lowering the measurement uncertainty may include the implementation of a second environmental chamber positioned around the stage and optics. State of the art environmental chambers with one-sigma air temperature stability of a few milli-degree Celsius at a single point have been demonstrated [8]. Implementing a similar system may further reduce the environmental variation error.
The uncertainty due to misalignment may also be reduced by adding a longer (approximately 1 m) secondary precision slide to the measurement setup, e.g., an air bearing system. In this design, the smaller positioning system would be mounted to the carriage of the air bearing slide via a wobble plate used for adjusting and aligning the travel of the smaller axis to the travel of the longer axis. Alignment of the two axes would be achieved by aligning each to an intermediate straightedge artifact with a low uncertainty displacement sensor, e.g., capacitance probe. The laser beam could then be aligned using the full travel of the longer axis. Substituting the travel of the shorter axis, 50 mm, with the travel of the longer axis, 1 m, in Eq. 18, results in alignment angle, \(\gamma\) , of approximately 6 arc seconds and an uncertainty due to misalignment, \(u_{MA}\), of 0.01 nm.
Last, manufacturing this class of stage from materials with low coefficients of thermal expansion will also help decrease the measurement uncertainty. For example, a list of suitable materials may include Silicon Carbide, Invar, and Zerodur, to name a few. Implementation of these materials would further reduce the standard uncertainty in compensating for \(E_{VE}\) to 0.8 nm, 0.5 nm, and 0.02 nm, respectively. The resulting expanded uncertainty for unidirectional repeatability due to each material would then be 3.2 nm, 2.0 nm, and 0.1 nm, respectively.
CLOSING REMARKS
A preliminary uncertainty analysis has been performed to highlight the challenges and identify the sources of error in measuring the linear positioning performance of this class of linear positioning system. Suggestions for reducing measurement uncertainty were provided. Future work will involve advancing our measurement capabilities to better measure all sources of error and to further reduce their individual contributions to the combined measurement uncertainty.
REFERENCES
- ASME B5.54, 2005, Methods for Performance Evaluation of Computer Numerically Controlled Machining Centers
- ISO 230-2:2006(E), Test code for machine tools – Part 2: Determination of accuracy and repeatability of positioning numerically controlled axes
- ANSI Z540.3, 2006, Requirements for the calibration of measuring and test equipment
- IS0/TR 230-9:2005(E), Test code for machine tools – Part 9: Estimation of measurement uncertainty for machine tool tests according to series ISO 230, basic equations
- JCGM 100:2008, Evaluation of measurement data – Guide to the expression of uncertainty in measurement, 2008
- Mielke et al., Displacement Measuring Interferometry, Tutorial, ASPE Annual meeting, October 2004
- Edlen, B., The Refractive Index of Air, Metrologia, 1966; 2: 71-80
- Lawton, K.M. and Patterson, S.R., A high-stability air temperature control system. Precision Engineering. 2000; 24: 174-182
* Official contribution of the National Institute of Standards and Technology (NIST); not subject to copyright in the United States. The full descriptions of the procedures used in the paper require the identification of certain commercial products and their suppliers. The inclusion of such information should in no way be construed as indicating that such products or suppliers are endorsed by NIST or are recommended by NIST or that they are necessarily the best materials, instruments, software or suppliers for the purposes described.